
Key performance indicators (KPIs) are used in every industry. They provide insight and quick-glance understanding of operations. The proton therapy industry has amassed a great list of metrics that center leaders can use to manage their organizations. Here are 10 of our favorites:
1. Patients Under Beam
This one is obvious and the most widely used metrics in the proton therapy space. PUB is simply the daily number of treatments or fractions being delivered in your center or on any given machine. PUB is typically averaged over a short time frame. We measure this on a weekly, monthly and quarterly basis depending on the report we are looking at.
PUB = Total Fractions During Period ÷ Number of Treatment Days in Period
2. Qualified Lead Rate
Every proton center receives patients from external sources, whether outside physicians or via marketing efforts. To test the quality of your business development and marketing teams, you should measure the Qualified Lead Rate (QLR). Each new lead should be assessed for probability to receive treatment at your facility. Although Apollo does not recommend it, most centers have a clinical review process for new leads. QLR can be calculated for any time frame, but is typically measured in rolling 3 month periods. We aim for a rate of 80% or higher with our development teams. Formula below:
QLR = Qualified Leads ÷ Total Leads
3. Lead Conversion Rate
Lead conversion rate (LCR) measures the overall success of your patient acquisition team. This is one of the most important proton therapy metrics and, as you will see later, helps set overall goals for development spending. Like a sales team, center leaders should know how many potential patients end up on your consultation roster. This metric will highlight your patient access teams ability to translate your competitive advantages and repertoire to potential patients. It is important to note that this metric’s denominator is qualified leads (see #2 above), therefore the success of your patient access team is only measured against patients that are qualified to receive treatment at your facility. This metric can be calculated on any time frame, but is typically measure on a rolling three month period. We aim for a LCR of 75% or higher. Formula below:
LCR = New Consultations Scheduled ÷ Qualified Leads
4. Consult Conversion Rate
Similar to LCR, Consult Conversion Rate (CCR) measures the overall throughput in your clinic. This metric is not meant to measure the success of each provider. After all, we want our providers making clinical decisions based on science and patient needs, not performance metrics. This metric is meant to be a gauge for leaders to estimate the number of new patient consults needed per week to reach their overall PUB goal. This metric is typically measured over longer periods of time. We like to use 6 months as a starting point and adjust later based on the weekly variation of disease mix. Formula below:
CCR = Total Treatment Starts ÷ Total New Patient Consults
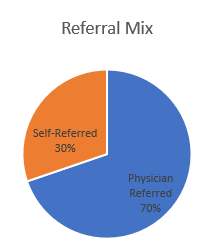
5. Referral Mix
This is one of the most basic proton therapy metrics. It is a simple comparison of total patient volume by lead source. Some healthcare leaders already measure this on a routine basis. In proton therapy, physician referrals tend to convert to treatment at a higher rate than self-referred patients. When accounting for the cost of marketing vs. physician relations, self-referred [also known as marketing sourced] leads tend to be higher cost than physician referred leads.
If your center employs a robust marketing program it is important to also measure the source of each patient within the self-referred category. These sub categories can be marketing campaigns or marketing types (digital, print, TV, radio, etc.). This will help you determine where your marketing dollars should be spent in the future. Furthermore, measuring QLR, LCR, and CCR for each sub category can lend insight into how your overall marketing effort is working.
Apollo Healthcare has mastered physician referral development, so prefer to rely on physician referrals over marketing sourced referrals due to the overall lower cost per lead. Therefore, when we look at our Referral Mix pie chart we want the majority of our leads to come from physician sources. Example graph:
6. Cost Per Lead
Cost Per Lead (CPL) relates to #5, but translates each lead into the overall cost based on the source of the lead. This metric is typically measured on a Monthly and Quarterly basis. As you will see we recommend multiple metrics within this category due to the complexity and importance of this metric.
Marketing CPL
Self-referred or ‘Marketing Sourced’ leads tend to be very costly, often being multiples higher than physician referred leads. This is due to the nature marketing expenses. Many proton centers are spending $350,000 per room per year on their marketing programs. That means a 3-room proton center could spend around $1 Million per year for marketing. Marketing-CPL (M-CPL) can be calculated with this formula:
M-CPL = (Marketing Salaries + Marketing Ad Cost + Content Creation + Materials) ÷ Total Qualified Self-Referred Leads
Referral CPL
On the opposite side of development we have physician relations, sometimes referred to as business development. This often consists of a physician liaison personally meeting with local referring physicians, community organizations, churches, charities and the like to educate them on the benefits of proton therapy. Most centers employ one to two physician relations executives bringing the cost of this program to nearly 25% of the cost of a similar marketing program at a 3-room center . The formula we use for Referral-CPL (R-CPL) is below:
R-CPL = (Physician Relations Salary + Development Activities + Development Materials) ÷ Total Qualified Physician Referred Leads
Development Spend Ratio
It is important to note that marketing should not be removed altogether. Marketing plays a vital role in the brand development and community awareness process. Apollo advocates that Development Spend Ratio (DSR) should be roughly equal to 1 at established proton centers. The resulting DSR metric represents the multiple you are spending on marketing over physician referred leads. For example, if your DSR is 2, you are spending 2 times as much for a marketing based lead compared to a physician referred lead. DSR can be calculated with the formula below:
DSR = (M-CPL) ÷ (R-CPL)
7. Prior Authorization Approval Rate
Prior Authorization Approval Rate (PAAR) is an easy metric to calculate. PAAR measures the success of your managed care team’s prior authorization process. Most proton therapy centers average around 15-20% for this metric. This is an important factor to consider when looking at long-term trends in center economics or payer mix. A higher rate typically translates to a higher commercial payer proportion, which subsequently bolsters a center’s bottom line. It is important to look at your PAAR values in various contexts. We like to look at PAAR by disease site, payer and policy type (Medicare Advantage, Self-Funded, Fully-Funded). We measure this on a rolling three months basis.
Apollo Healthcare specializes in proton therapy prior authorization and has been able to achieve a success rate of over 70% in some cases.
PAAR = Total Prior Authorization Approvals ÷ Total Prior Authorization Submissions
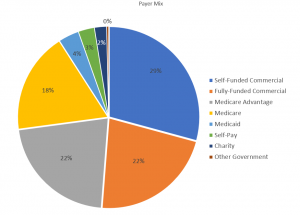
8. Payer Mix
This one is the most commonly used KPIs in healthcare. Payer Mix is a very important metric for proton therapy centers because of the difficult economics each center is faced with. High debt loads and low commercial coverage typically result financial struggles. If you use PAAR (see #7) and Payer Mix together you can keep an eye on your overall commercial proportion and adjust your operation when things start falling out of tolerance. We aim to keep commercial mix at least 40% in centers we manage. A typical payer mix chart is illustrated like the example below:
9. Average Simulation to Treatment Start Time
Average simulation to treatment start time (Sim-to-Start) is a controversial proton therapy KPI because so many factors can effect the outcome. We like to measure it anyway because it provides much needed planning insight for the overall pipeline and throughput. A key point about this metric is that we do not measure consult to start time, which is where many centers fail. Including the consultation timeline assumes that all patients need to be treated immediately, which is routinely not the case. For example, a prostate cancer patient may see a their Radiation Oncologist in consult and subsequently go on Androgen Deprivation for a few months. You do not want these variance effecting your metric, so it’s important to start the timeline at simulation when we know the patient is moving forward with treatment.
We typically measure this KPI by calculating the number of days between the simulation date and the treatment start date for all patients with a treatment start in a given time frame (typically 3 months). When then average all of those day totals to get our average Sim-to-start. See below for clarification:
1. Compile an excel file with all patients with a treatment start in a given time frame
2. Make sure the excel file has each patient’s simulation date and treatment start date separated into columns.
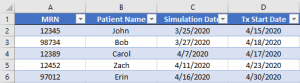
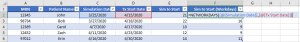
3. Calculate the number of days between simulation date and Treatment start date for each row. This can be done by subtracting Simulation Date from Treatment. See example below:
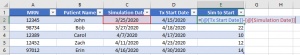
4. Calculate the Net Work Days between Sim-to-start. This is an extra metric and helps you understand how many working days were in your Sim-to-Start timeline.
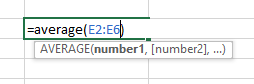
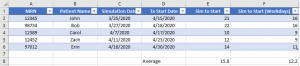
5. Average both columns to see your overall Sim-to-Start averages for total days and working days.
10. New Treatment Starts
The New Treatment Starts (NTS) metric is where all of these KPIs come together. It is a simple count of new patients starting a course of therapy in any given time frame (typically per week).
Based on everything you’ve measured so far, you can set target NTS goals for each week and month in operation. Furthermore you can back through the process and calculate the total number of leads you need to fill your center’s PUB goal. I’ve outlined an example of our thought process below:
Example
1. A single proton center room can easily treat 30 patients per day or 7,800 per year. If we assume the average course of therapy is 28 fractions, we can estimate we will need approximately 278 patients start in that year. Divide that by 52 weeks and we see that 5-6 NTS per week are needed to sustain a load of 30 patients on one treatment room. Therefore a three room center with a total daily target of 90 treatments will need 15-18 NTS per week to remain at 100% utilization.
2. Take that NTS goal and back it into your CCR (see #4). Lets assume our physicians in this example have a CCR of 70%. We already know we need 18 NTS to remain at full capacity. Therefore, we need approximately 26 new patient consults (18 ÷ 0.7) to reach our goal.
3. Take it one step further and calculate the number of leads you need. If we assume our LCR is 60% we can calculate we will need 43 qualified leads to reach our goal (26 ÷ 0.6). If you apply your overall cost per lead to this metric you can calculate the necessary spend needed to reach your goal.
Simple as that. Proton therapy metrics do not have to be hard. If you stick to this list, you will be on the right track to effectively managing your proton therapy operation.
Please give us a call if you have any questions. We would be happy to walk you through any of these proton therapy metrics.
If you or your center are in need of operations consulting or help with your proton therapy metrics, please reach out to us. Apollo Healthcare specializes in proton therapy operations and has vast experience from multiple proton therapy centers and projects. We’re excited to hear from you.